Using Cycle Time Distributions to Make Better Delivery Decisions
Originally published June 2026
This is the second in a three-part series
In the first article of this series, we explored why right sizing matters and how a Cycle Time Distribution (CTD) chart reveals the natural variability present in every delivery system. Knowing that variability exists is valuable, but it naturally leads to another question: what should a team actually do with a CTD once they have one? The answer is where right sizing becomes practical. Rather than serving as an interesting report on past performance, a CTD becomes a decision making tool that influences how work is shaped before it ever enters the workflow.
Looking Beyond the Average
Many organizations naturally gravitate toward averages because they are familiar and easy to communicate. Unfortunately, averages rarely tell the whole story. Two teams can have the same average cycle time while delivering work with dramatically different levels of predictability. One team may consistently finish within a narrow range of days, while another occasionally experiences very long running work that stretches delivery expectations. Looking only at the average hides those differences.
This is why CTDs encourage teams to think probabilistically instead of deterministically. Rather than asking, 'How long will this take?' teams begin asking, 'Based on how our system actually performs, how confident are we that work of this size will finish within a given timeframe?' That subtle shift changes planning from speculation to evidence-based decision making.
Choosing the Right Confidence Level
Although the mean, median, and mode each provide useful information, percentiles are what make a CTD especially valuable. A percentile tells us the percentage of historical work items that completed in a given amount of time or less. For example, if the 85th percentile falls at ten days, then 85 percent of completed work finished in ten days or fewer. It does not guarantee that every future item will finish in ten days. Instead, it communicates the level of confidence supported by historical data.
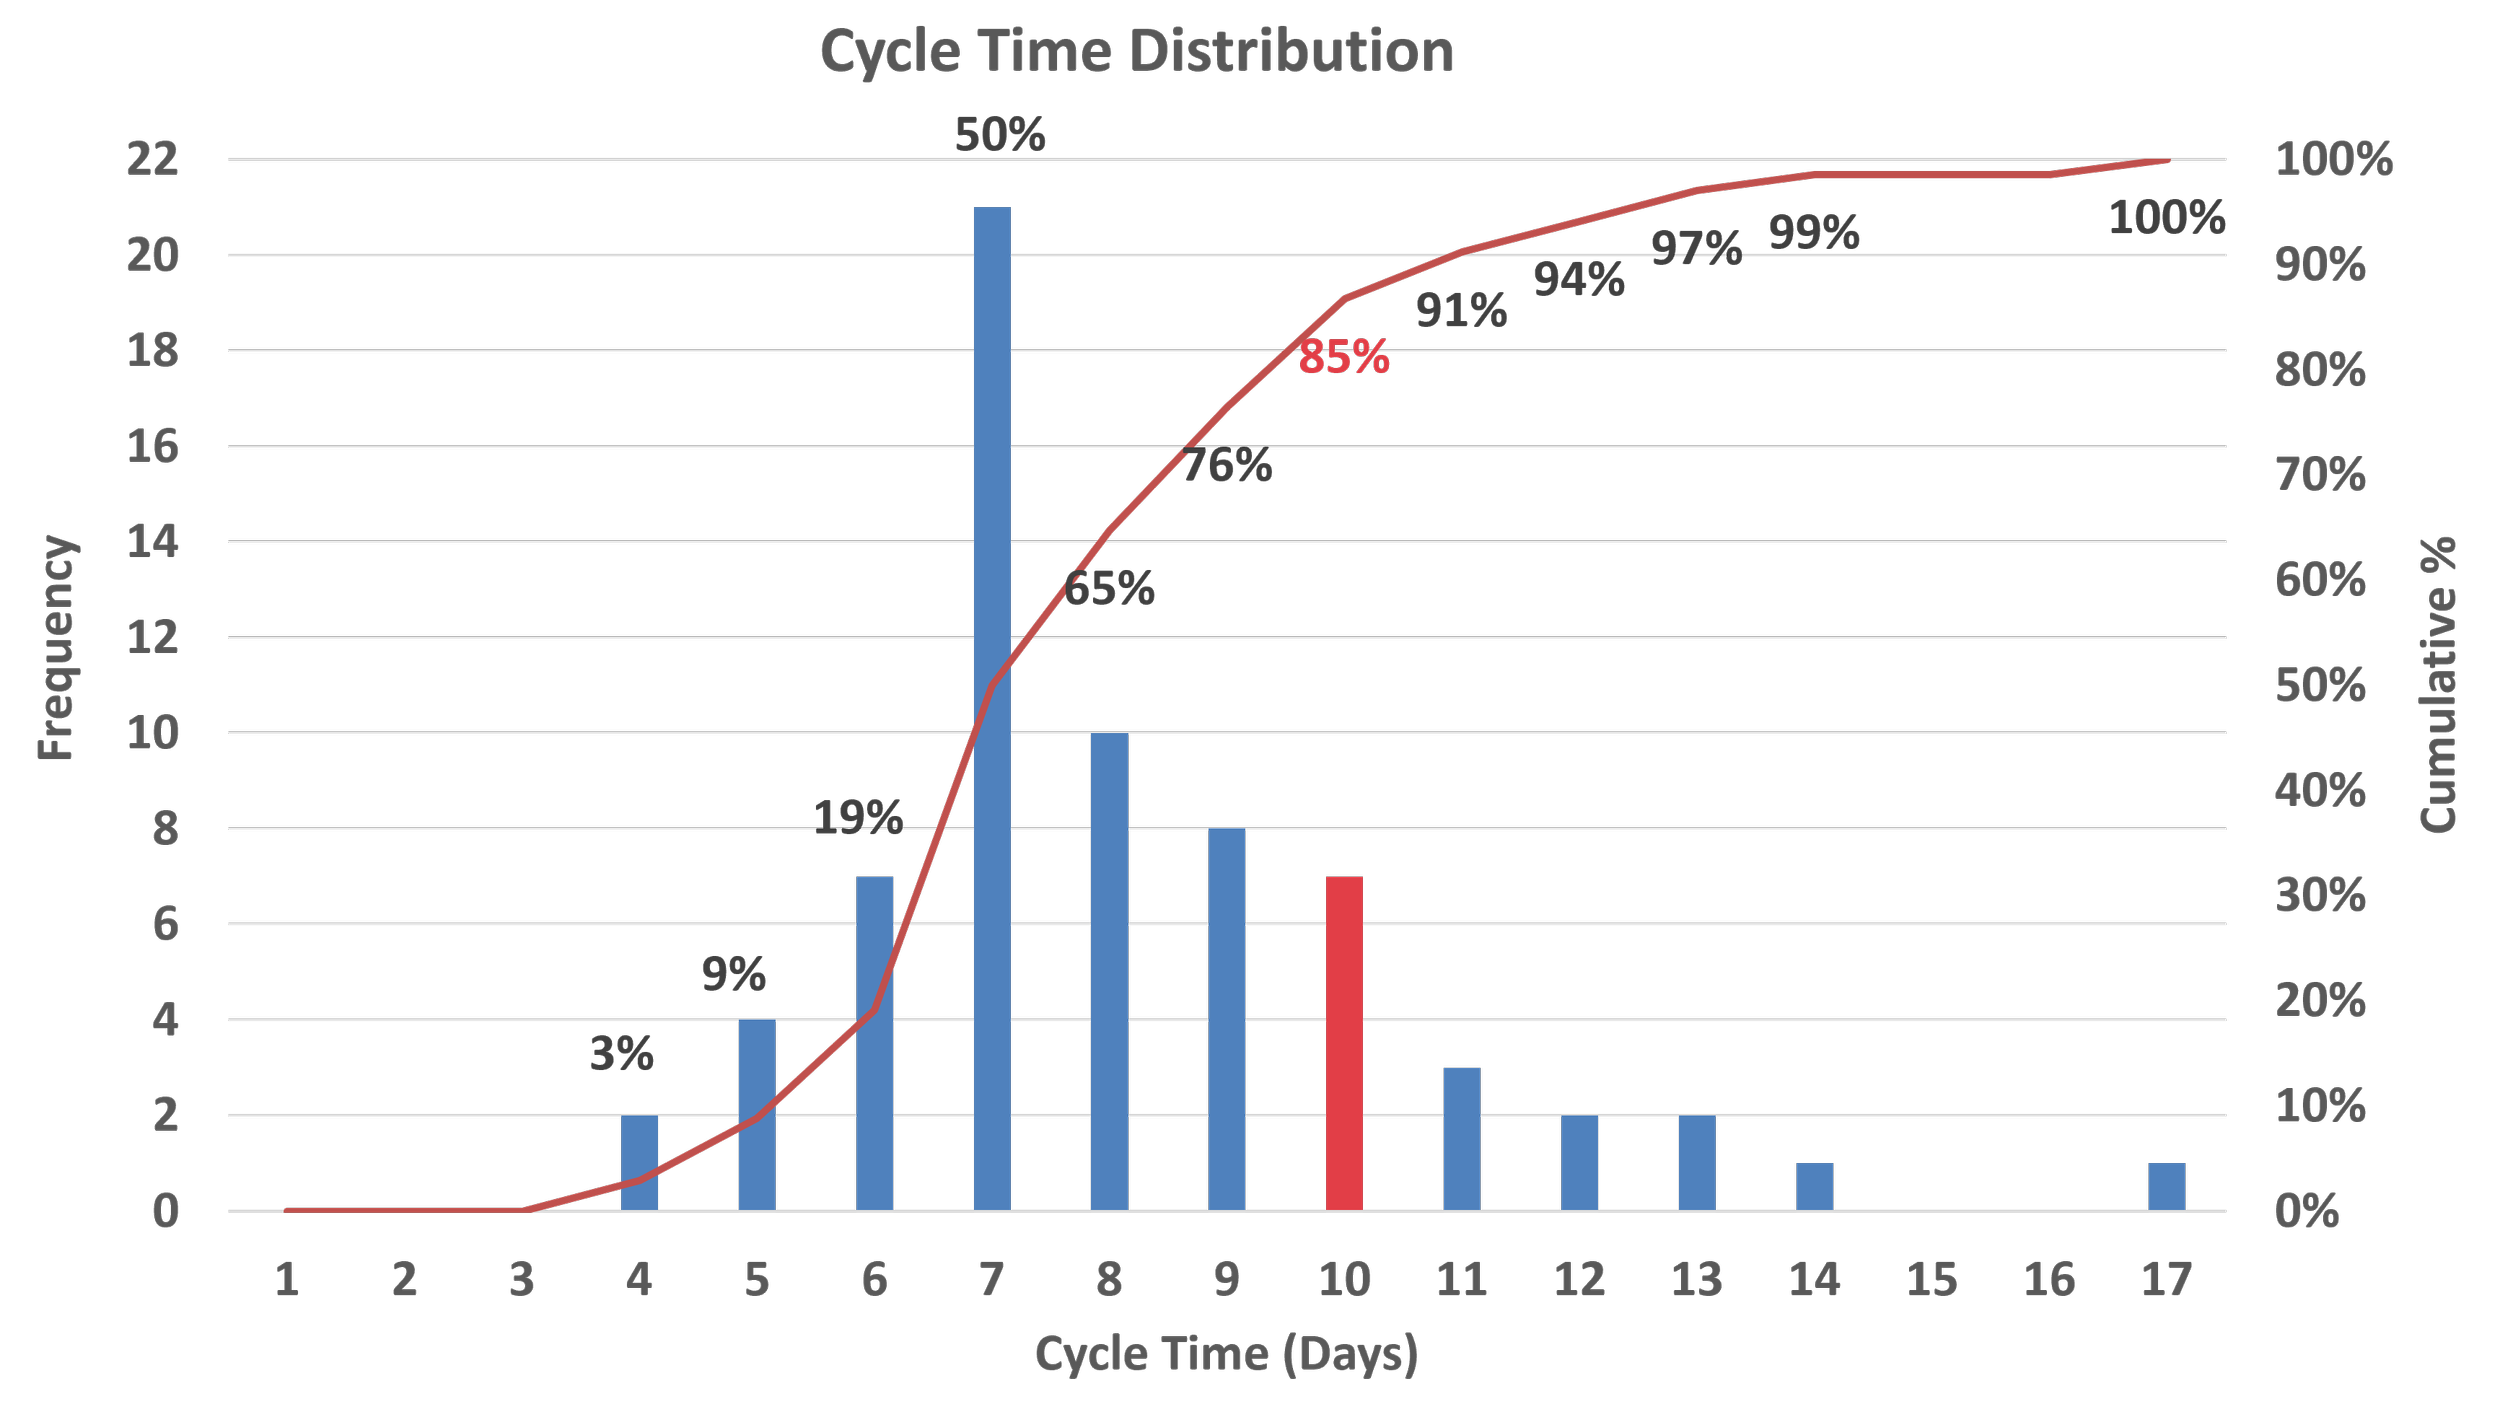
A CTD with the 85% percentile highlighted. In this system, 85% of items finish in ten or fewer days.
This distinction is important because it changes the nature of delivery conversations. Estimates are opinions about the future. Percentiles describe what the system has repeatedly demonstrated it can achieve. That makes them far more useful when discussing delivery expectations with stakeholders.
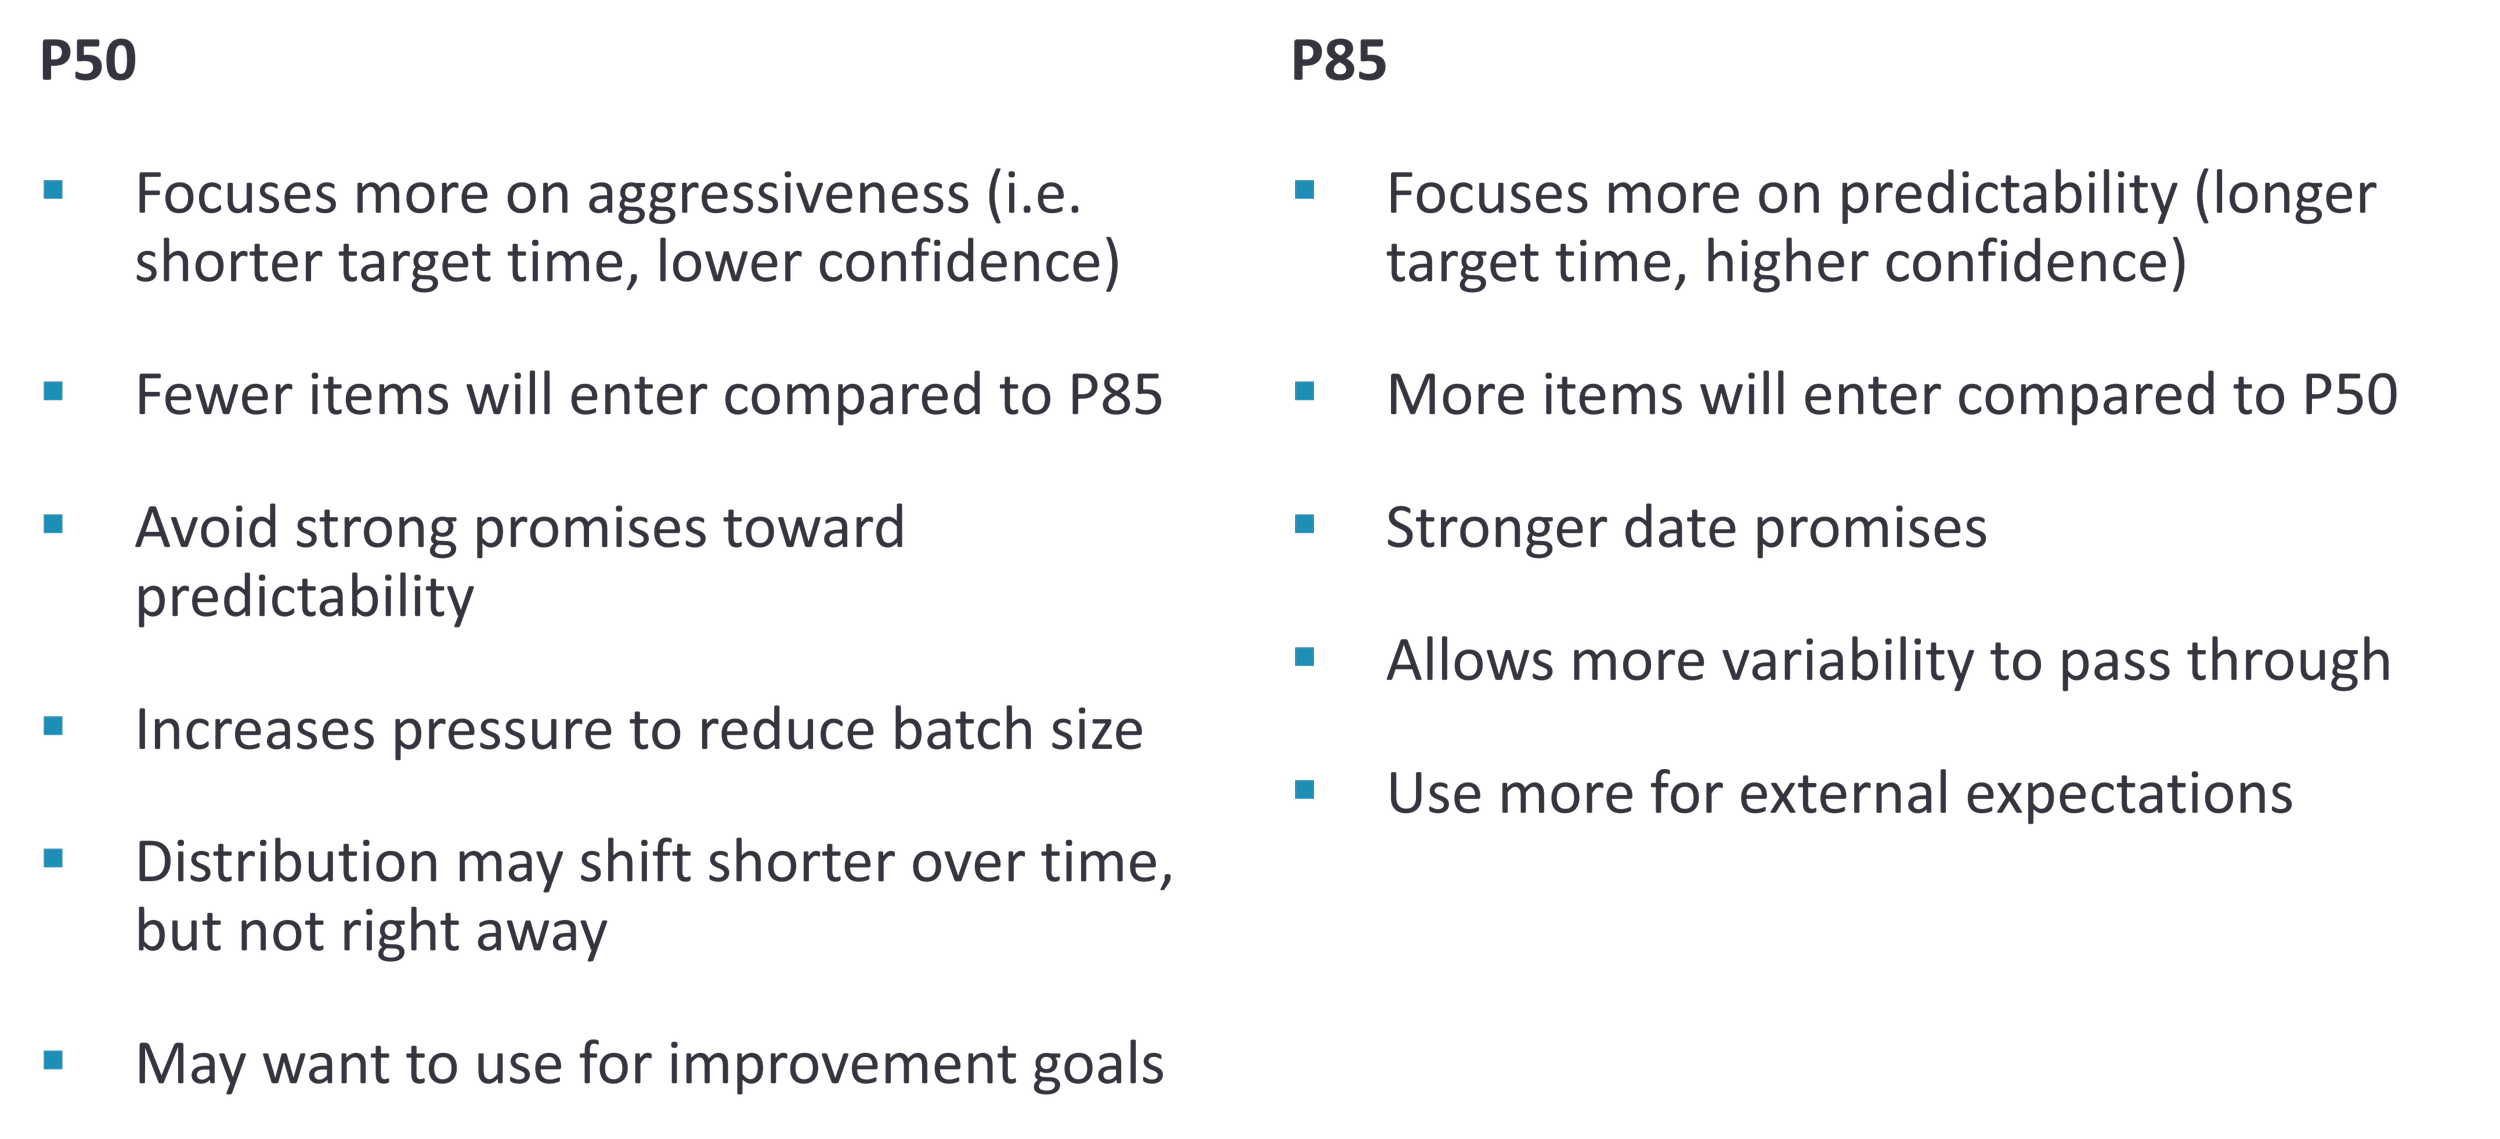
The Kanban community frequently uses the 85th percentile because it strikes a practical balance between confidence and flexibility. Choosing a lower percentile, such as P50, creates a more aggressive target but one that succeeds only about half the time. Choosing a higher percentile increases confidence but also extends expected delivery times. There is nothing magical about 85 percent. It simply represents a balance that many organizations find useful. The appropriate percentile should reflect the amount of delivery risk your organization is willing to accept.
Turning Data into Better Decisions
Once a team agrees on an appropriate percentile, the CTD becomes a remarkably simple planning tool. Imagine a team whose data shows that 85 percent of work completes within ten days. During backlog refinement the discussion is no longer, 'Is this a five point story or an eight point story?' Instead, the conversation becomes, 'Does this work appear capable of flowing through our system within ten days?' If the answer is yes, the work is likely right sized. If the answer is no, the work is split, simplified, or clarified before development begins.
Notice what has happened. The discussion has shifted away from estimating effort and toward improving the work itself. Teams spend less time debating abstract sizing scales and more time reducing uncertainty, exposing dependencies, clarifying acceptance criteria, and identifying opportunities to deliver value sooner. Right sizing does not eliminate uncertainty. It manages uncertainty by intentionally shaping work so it aligns with the demonstrated capability of the system.
Selecting a percentile also allows a team to establish a Service Level Expectation (SLE). An SLE is a probabilistic delivery expectation derived from historical performance. Instead of making promises based on optimism, teams communicate expectations grounded in evidence. Conversations become clearer because everyone understands the level of confidence behind the commitment.
Perhaps the biggest benefit of this approach is that planning meetings become more productive. Rather than spending significant time assigning estimates, teams focus on asking better questions. Are there hidden dependencies? Can this work be split into independent value slices? Are unknowns better handled through a short spike? Those discussions improve flow far more than debating whether something deserves another story point.
From Measurement to Continuous Improvement
A CTD is much more than a historical report. It provides a feedback loop that continuously helps teams shape work around the realities of their delivery system. As new data is collected, the distribution evolves, giving teams an ongoing way to refine their sizing decisions and improve predictability over time.
Of course, not every CTD tells the same story. Some distributions are tight and predictable. Others develop long tails that quietly reduce delivery confidence. Still others reveal that multiple kinds of work are being mixed together under a single policy. Learning to recognize those patterns is where CTDs become truly powerful. In the next article, we'll examine several real-world distributions and explore what each reveals about workflow health, delivery risk, and opportunities for improvement.